
Original Research · 2027 Edition
The 2027 Northern New Jersey Lawn Soil Health Report
What 249 laboratory soil tests from real lawns in Union, Essex and Morris Counties reveal about pH, potassium and phosphorus — and what it means for your lawn this spring.
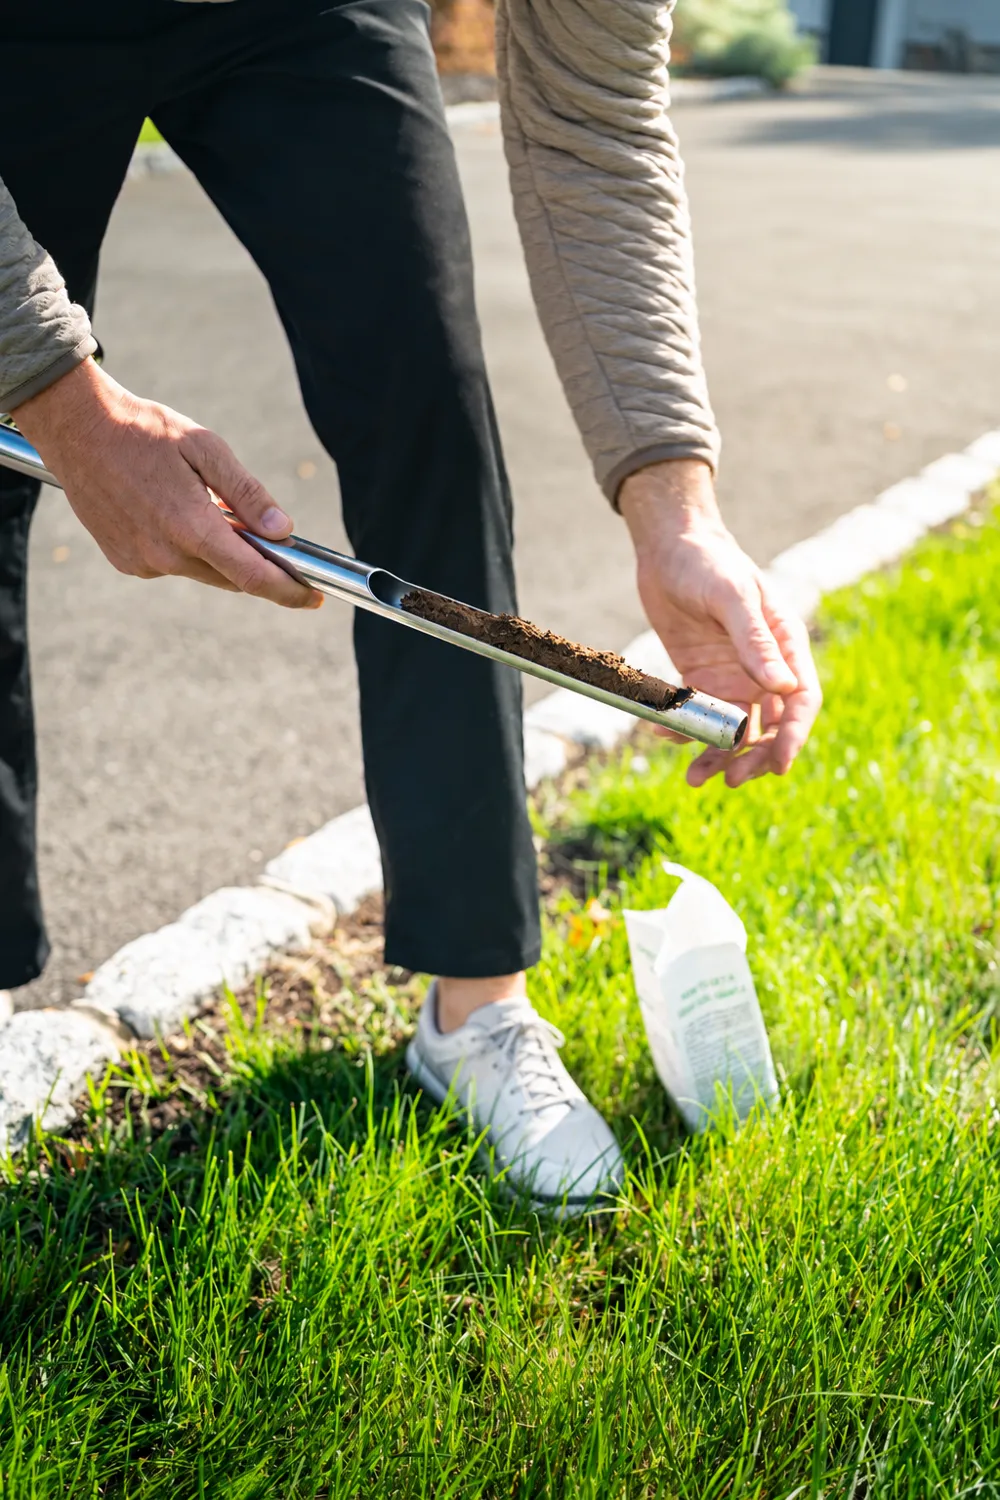 Real cores, real lawns
of lawns already in the ideal 6.0–6.8 pH range for cool-season turf
average soil pH (range 4.9–7.4)
below pH 6.0, where a lab-guided lime correction makes sense
lab soil tests across 21 communities
Preliminary edition · 2026-season samples · Final results will be added after fall testing.
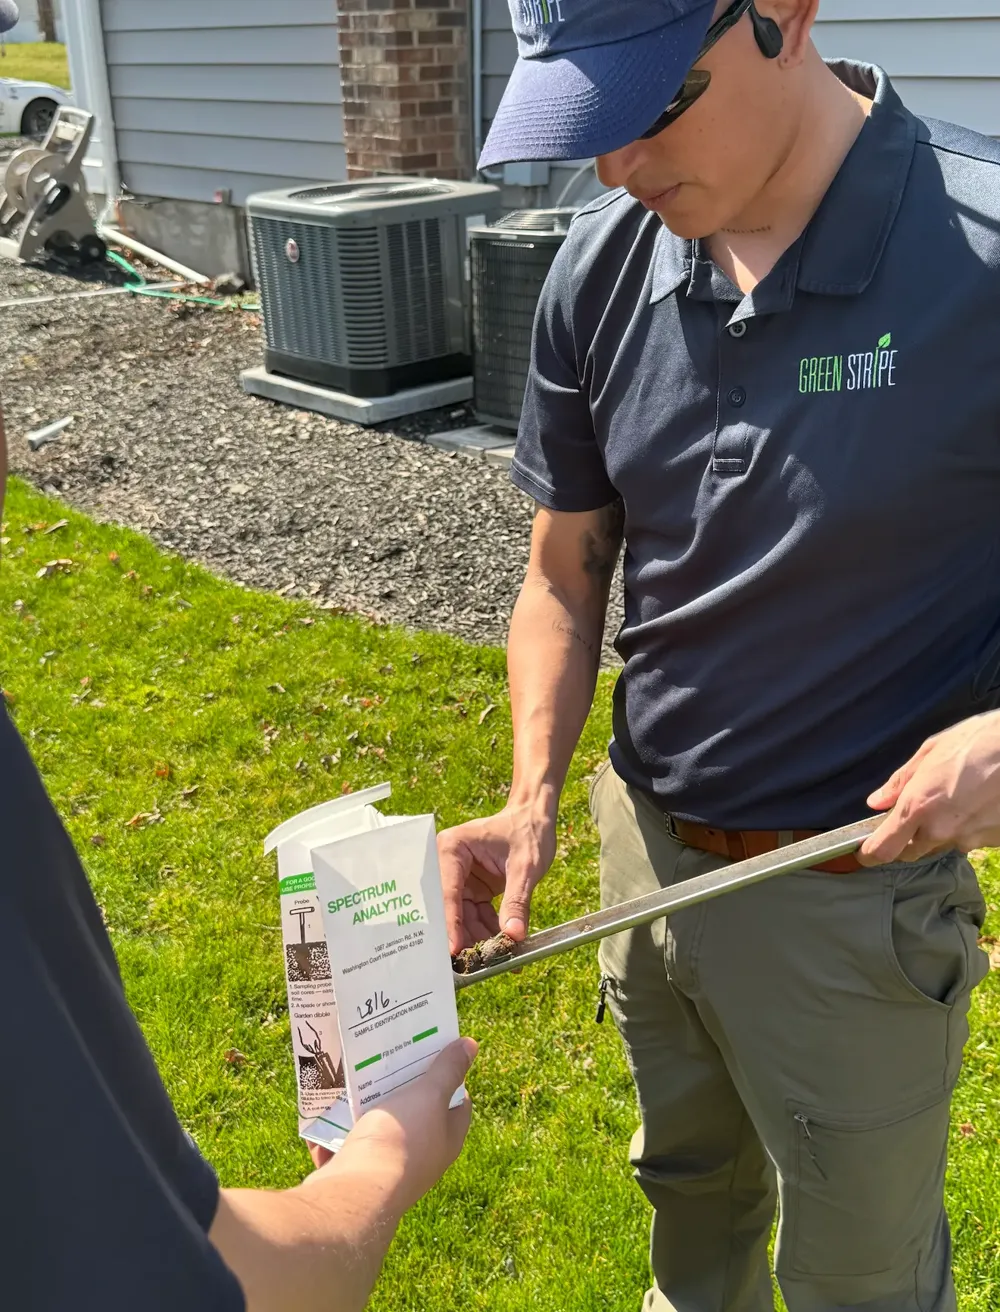
Methodology
How we gathered the data
Every number on this page comes from independent laboratory analysis of soil cores pulled by GreenStripe technicians from customer lawns between May 7, 2026 and September 9, 2026. Results were exported without names, addresses or any customer details and grouped by town. Towns with fewer than 5 samples are combined so no single property can be identified.
These are lawns we already care for, not a random survey, so they describe the turf we see every day rather than every yard in New Jersey.
Organic matter
3.4%
Regional average across the tested lawns
Organic matter is decomposing plant and other organic material in the soil. It helps soil hold water, supports soil structure and keeps nutrients cycling.
Nutrient-holding capacity (CEC)
10.5meq/100g
Regional average across the tested lawns
Cation exchange capacity describes your soil’s ability to hold nutrients such as potassium, calcium and magnesium. It depends on the soil’s clay and organic matter.
These averages are context, not targets. Soil texture, drainage and your own laboratory results determine whether amendments are needed; more organic matter or a higher CEC is not automatically better.
Town-by-town benchmarks
Sort any column or search for your town.
Cranford
Union County · 34 samples
6.01avg pH · 4.9–6.8- In ideal range
- 53%
- Below pH 6.0
- 47%
- Potassium low
- 41%
Union
Union County · 32 samples
6.03avg pH · 5.2–6.7- In ideal range
- 59%
- Below pH 6.0
- 41%
- Potassium low
- 41%
Westfield
Union County · 28 samples
5.99avg pH · 5.2–7.2- In ideal range
- 43%
- Below pH 6.0
- 50%
- Potassium low
- 14%
Clark
Union County · 27 samples
5.95avg pH · 4.9–7.4- In ideal range
- 41%
- Below pH 6.0
- 56%
- Potassium low
- 30%
Scotch Plains
Union County · 20 samples
5.92avg pH · 5–6.9- In ideal range
- 40%
- Below pH 6.0
- 55%
- Potassium low
- 35%
Summit
Union County · 19 samples
6.44avg pH · 5.7–7.2- In ideal range
- 84%
- Below pH 6.0
- 11%
- Potassium low
- 32%
Springfield
Union County · 16 samples
6.11avg pH · 5.2–6.8- In ideal range
- 75%
- Below pH 6.0
- 25%
- Potassium low
- 62%
Maplewood
Essex County · 12 samples
6.37avg pH · 5.6–7.3- In ideal range
- 67%
- Below pH 6.0
- 17%
- Potassium low
- 33%
Millburn
Essex County · 11 samples
6.37avg pH · 5.7–7.1- In ideal range
- 55%
- Below pH 6.0
- 27%
- Potassium low
- 45%
Chatham
Morris County · 10 samples
6.32avg pH · 5.8–6.9- In ideal range
- 60%
- Below pH 6.0
- 20%
- Potassium low
- 40%
Fanwood
Union County · 10 samples
6.12avg pH · 5.4–6.9- In ideal range
- 60%
- Below pH 6.0
- 30%
- Potassium low
- 20%
Short Hills
Essex County · 6 samples
5.95avg pH · 5.4–6.6- In ideal range
- 67%
- Below pH 6.0
- 33%
- Potassium low
- 17%
Kenilworth
Union County · 5 samples
5.68avg pH · 5.3–6.1- In ideal range
- 20%
- Below pH 6.0
- 80%
- Potassium low
- 40%
Mountainside
Union County · 5 samples
6.30avg pH · 5.8–7- In ideal range
- 60%
- Below pH 6.0
- 20%
- Potassium low
- 40%
A further 14 samples from smaller-sample communities are included in the regional totals only.
Your town is a benchmark. Your lawn has its own numbers.
A complimentary laboratory soil test is included with our lawn care programs—not offered as a standalone visit.
Key Findings
What the numbers mean
1. Most lawns sit in a healthy pH range
For tall fescue, Kentucky bluegrass and ryegrass, the practical target is pH 6.0–6.8. 55% of the lawns we tested already sat in that range, so a reading like 6.2 is healthy, not a problem. These lawns get only our light maintenance lime to hold pH steady against the season's fertilizer.
38% tested below 6.0, where nutrients become less available and a corrective lime application, sized by the lab's buffer test, is worth doing. Only 6% were above 6.8, where adding lime would do more harm than good.
2. Potassium: worth checking, not a crisis
33% of lawns tested low for potassium, 43% medium and 24% adequate. A medium reading is workable for most lawns; the low group is where extra potassium helps with stress tolerance through cold and drought.
3. Phosphorus is rarely the problem
Average phosphorus was 105 ppm (median 91 ppm), generally plenty for established turf. That lines up with New Jersey's fertilizer law, which limits phosphorus unless a soil test shows a need — another reason to test before you treat.
Results varied widely even within a single town, which is why one lawn's test can't stand in for its neighbor's.
Independent soil testing
Prefer to test your soil yourself?
GreenStripe’s soil testing is part of our ongoing lawn care programs; we don’t offer testing-only visits. For independent testing, Rutgers Cooperative Extension’s residential soil testing page provides sampling and submission guidance.
Visit Rutgers Soil Testing Lab (opens in a new tab)A lawn care plan built on your soil
Every GreenStripe lawn care program includes a complimentary laboratory soil test — a $95 value — to guide your ongoing treatments. It’s part of your program, not a standalone testing service.